Machinery and equipment of agricultural and horticultural enterprises in 2023
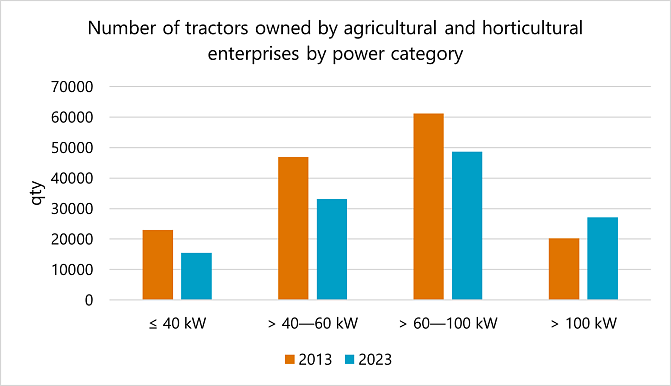
In 2023, some 124,500 tractors operated on farms. Ten years earlier in 2013, it could be said in general that everyone working in agriculture and horticulture had their own tractor, given that there were 151,300 tractors on farms, roughly the same amount as there were people employed in agriculture and horticulture. In 2023, the number of tractors exceeded the number of people employed in agriculture and horticulture by almost 6,000 tractors.
- Some 124,500 tractors operated on farms. Roughly 97 per cent of farms used their own farm tractor.
- Agricultural and horticultural enterprises had 2.9 tractors per farm on average.
- Most tractors were in the regions of Southwest Finland (16,860) and Southern Ostrobothnia (14,110).
- Almost 40 per cent of tractors owned by agricultural and horticultural enterprises were in the >60–100 kW power category. The second highest number of tractors, roughly 20 per cent, were in the 100–200 kW power category. Approximately one per cent of all tractors were in the >200 kW category.


- Some 46 per cent of farms owned a combine harvester in 2023. Nearly a quarter of all farms used a combine harvester owned jointly by several farms or wholly by an external party.
- Roughly 80 per cent of farms owned tillage machinery 73 per cent owned seeders and/or planters, and almost half of all farms owned application equipment for plant protection products. Farms may have used both options.
- Of all farms that owned application equipment for plant protection products, 68 per cent used spray nozzles that reduce wind drift.
Use of precision farming methods varies by production sector
The 2023 Farm Structure Survey identified the precision farming methods used on farms during the reference year, including the use of geospatial data, soil sampling, automatic control systems, band spraying, robotics and GPS-assisted plant protection product application. The use of such methods was most common in pig and poultry husbandry.
- Soil samples (for soil fertility testing, for example) were taken by 58 per cent of farms during the reference year. In all regions of the Centres for Economic Development, Transport and the Environment (ELY Centres), the percentage of farms taking soil samples was highest in Ostrobothnia – 67 per cent.
- Geospatial data on harvests, growth, soil or growing conditions was used by less than ten per cent of farms. In poultry husbandry, as many as a quarter of all farms used the method in 2023. The method covers the use of harvest maps, the measurement of growth and soil properties, and weather stations.
- Automatic control systems, or automatically adjusted application and sowing volumes, were used by less than ten per cent of farms. In pig and poultry husbandry, they were used by almost 30 per cent of farms.
- Robotics was used by slightly more than three per cent of all farms across Finland. Its use was most common in pig husbandry (13 per cent) and least common in the production sector of other grazing livestock (less than one per cent). Robotics covers real-time kinematic positioning (RTK), autonomous machines and robotic picking systems.
- Plant protection product band spraying was used by roughly three per cent of all farms, most typically in outdoor production (roughly 23 per cent).
- Plant protection products were sprayed using GPS control on roughly 12 per cent of farms.
Internet, planning software and occupational safety plan
- Almost 90 per cent of all agricultural and horticultural enterprises used the Internet in farm management.
- Slightly less than 60 per cent of farms used planning software to plan and monitor farm operations or finances.
- Almost a quarter of all farms (23.5 per cent) had prepared a written occupational safety plan. The percentage was highest in pig husbandry, with 60 per cent of farms having prepared a plan. In contrast, the percentage was lowest in cereals production, in which the corresponding figure was 15 per cent.


Allow functional cookies to show the embedded graph.


